Summary: Latitude vs. X
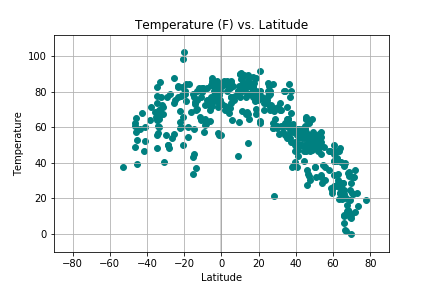
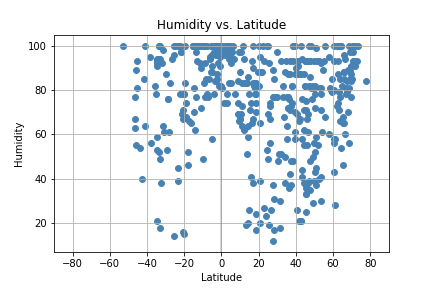
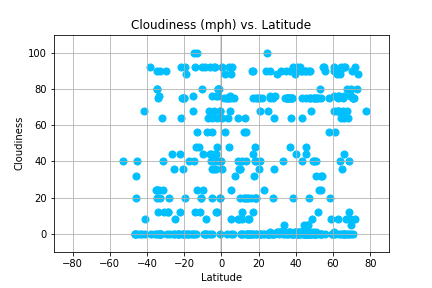
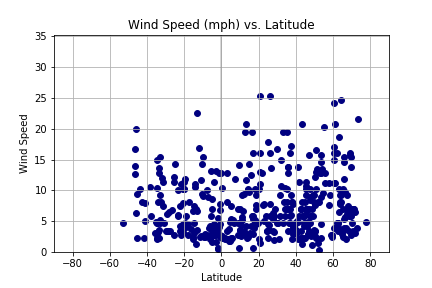
The intent of this project was creating a Python script to visualize the weather of 500+ cities across the world of varying distance from the equator. To accomplish this, I used a simple Python library and the OpenWeatherMap API. The objective was to build a series of scatter plots to showcase the following relationships: Temperature (F) vs. Latitude, Humidity (%) vs. Latitude, Cloudiness (%) vs. Latitude, and Wind Speed (mph) vs. Latitude.
This site provides the source data and visualizations created with Matplotlib as part of the analysis, as well as explanations and descriptions of any trends and correlations observed in the dataset
Visualizations