Summary: Latitude vs. Temperature
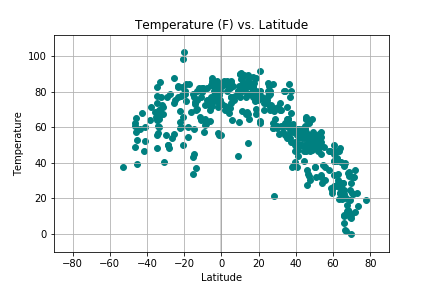
The analysis of the random cities latitude versus their maximum temperature occured on March, 2018. We can observe in the graph that during this time of the year the Northern hemisphere is cooler than the Southern hemisphere. Also, as expected the cities closer to the equator(latitude = 0) are the ones with the greatest max temperature, which might be due to the tilt of the earth. Most of the cities generated are located in the Northern Hemisphere so this study may have slanted data that fits preconceived notions of findings.
Visualizations